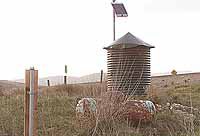
| The gaging station near Soldiers Summit is one of more than 100 facilities located along streams in Utah. Originally manually read, many stations are now automated and stream flow information is posted on the Internet. |
History is filled with examples of how mankind measures almost everything.
Property is measured by acreage.
Mankind measures money in dollars, pounds, pesos, etc
Time is measured in hours, days, years, decades and centuries.
Mankind also measures water.
As water is piped into a home from a municipal system, a district or city measures consumption by the gallon based on a meter that has been set in the line.
In most cases, the transmission line leading to the meter and the water consumption measuring device belong to the controlling entity. The line from the meter to the residence and inside the structure belong to the individual property owner.
However, the state owns the water. The service district, the city, the county and private residents are basically paying for the system that delivers the water and for the right to use the liquid.
The average home in the United States uses less than 10,000 gallons of water per month, according nationally compiled data. Average residential consumption represents a small factor in the scheme of water matters.
A debate continues to rage in certain circles in the world community as to whether fresh, clean water should be a human right or a commodity that is bought and sold to the highest bidder.
The issue is an age old question, but one with more meaning as the world’s population grows by leaps and bounds while fresh water is a finite natural resource.
Official estimates vary, but it is generally accepted that less than2 percent of the world’s supply of the natural resource is fresh water. The rest is salt water in the oceans.
Of the 2 percent, more than half is locked up in ice on the two polar caps. A limited amount of fresh water is produced annually, with the evaporation and precipitation cycle being fairly predictable on a global basis.
Water is deceiving. A small space can contain a significant amount of water, yet a large lake or reservoir full to capacity can be depleted quickly by the agricultural and municipal uses.
For example, Lake Superior is considered to be the greatest of the great lakes because of its size and depth. Lake Superior is 350 miles long and 160 miles wide, with a depth of more than 1,300 feet.
Lake Superior has the storage capability to cover the continental United States with one foot of water. The U.S. mainland has 3,608,787 square miles of surface. Multiply the surface by 640 acres per square mile. The total is 2,309,623,680 acre feet of water.
By comparison, Scofield Reservoir can store 73,600 acre feet of water at capacity. According to state water engineer Mark Page, the level at Scofield currently exceeds 25,000 acre feet. Although the water level continues to rise due to spring runoff, Scofield Reservoir is only about one-third full.
“Also, remember that 8,000 acre feet of that water is what is called dead water,” noted Page during an iterview on Wednesday. “That is water in the bottom of the reservoir that is lower than the drainage from the reservoir can remove.”
According to data compiled by experts, the entire Great Lakes system – Superior, Michigan, Huron, Erie and Ontario – contains more than 50 percent of the world’s fresh water supply.
Therefore, the other lakes and streams in the United States, the nation has a vast majority of fresh water that is not locked up in ice that exists in the world.
Water, and it’s measurement has always been an issue, but in the eastern, southern and much of the upper midwest there has generally always been enough of it to go around. But the west and it’s rivers are a different sort of animal.
Water in the west in the form of precipitation falls largely in the mountains, from which streams flow through vast desert areas, turning those little areas around the streams into literal oasises, while the vast majority of the countryside is barren and survives on the little rainfall that does occur.
This means the streams become the life blood of the region and with the intervention of man and his laws about distribution, rights and use, measurement became most important.
Water agreements between various government and private agencies, including those between states such as the Colorado River Compact (CRC), often guarantee certain amounts of water to be delivered to downstream users.
That particular agreement guarantees the lower basin states (Arizona, California and Nevada) 7.5 million acre feet of water per year.
This means that the upper states must make sure (and the lower basin states want it verified) that amount of water is delivered each year.
To do this, a series of “gaging stations” were set up many years ago.
Tied to the large stations directly on the major rivers (such as the one just above Grand Junction, Colo; that can be seen from I-70 by motorists) are a series of smaller stations on other streams farther up the drainage.
Not all of these were put in place for the CRC, but they add to the data that shows how much water is being contributed by various tributaries.
These stations are regulated and monitored by the United States Geological Survey (USGS).
Manual monitoring used to be the norm, but in these days of modern electronics and solar power, even some of the remotest stations can be monitored 24 hours a day.
For instance, at 10:40 on Wednesday morning May 21, the Price River near Heiner was flowing at 77 cubic feet per second (cfs) and was under the 10 percentile for that day in an average year according to the survey’s monitoring system.
In contrast, the station on the White River, just off of US 6 between Scofield Junction and Soldiers Summit measured a stream flow of 117 cfs that falls in a 25 to 75 percent category of normal for that day indicated the survey site.
At the same time, the Colorado River, near the Utah-Colorado border measured 119,000 cfs that falls in a 25 to 75 percent category.
“These instruments must be recalibrated periodically,” states Page. “For instance, a flood period may change a stream depth or width and the USGS must change the measuring devices to reflect those differences.”
In Utah, there are 129 of these stations located on various drainages. Some streams only have one, other streams have multiple locations due to the fact that tributaries flow into them and major users along the streams can change the water flow from one point to another.
As of Wednesday morning, no ranked stream in Utah that is on the USGS website was flowing at all time highs or even above 90 percent of normal.
Most of these streams are in the lower ranges according to the geological survey system, but stream flows have been slow to grow this year because of the cool, wet spring.
Most experts expect the stream flows to pick up considerably over the next week as the warm weather strikes.
But in the drought the state is presently in, it is not so much when the stream flow picks up and reaches higher capacity, but for how long it does that, particularly in those areas where streams feed reservoirs and lakes that supply water to agriculture and culinary purposes for the summer.
Those interested in seeing present stream flows on electronic gaging stations can go to the national Internet website at www.usgs.gov and click on realtime stream flow and then click on Utah on the station map.
Once on the Utah segment, individual stations are listed and can be read.